Grafana for Beginners: What Is It and What Is It Used For?
If you are starting to learn about monitoring, DevOps, system administration, or you simply want to understand what happens with an application after it is deployed to production, sooner or later you will come across the name Grafana.
And honestly, that is not surprising.
Grafana is one of those tools that appears very often in real IT environments. You can find it in application monitoring, server monitoring, database monitoring, container environments, Kubernetes, cloud services, and even business dashboards.
In this article, I want to explain in simple terms what Grafana is, what it is used for, and why it is worth learning.
No unnecessary theory. Just a practical explanation.
What Is Grafana?
Grafana is a tool for visualizing, analyzing, and monitoring data.
In simple words, Grafana allows you to turn raw technical data into readable charts, panels, dashboards, and alerts.
Instead of looking at dry numbers, logs, or metrics in a terminal, you can see everything in a clear dashboard.
For example, in Grafana you can monitor:
- CPU usage,
- RAM usage,
- server load,
- number of application errors,
- API response time,
- number of HTTP requests,
- Docker container status,
- Kubernetes metrics,
- database metrics,
- application logs,
- service availability,
- system performance.
So instead of guessing what is happening with your application or server, you can simply see it.
And that is the biggest value of Grafana.
What Is Grafana Used For?
Grafana is mainly used to monitor systems and detect problems faster.
Imagine a simple situation.
You have a web application. Everything works fine, but suddenly users start reporting that the website is slow. Without monitoring, you start guessing:
- maybe the server is overloaded,
- maybe the database is slow,
- maybe the application has a bug,
- maybe the issue affects only some users,
- maybe something went wrong after the last deployment.
Now imagine the same situation, but this time you have Grafana.
You open the dashboard and see:
- CPU usage increased to 95%,
- the number of API requests increased significantly,
- application response time jumped from 200 ms to 3 seconds,
- the database started responding more slowly,
- new errors appeared in the logs.
Immediately, you have more information. You do not have to search blindly.
Grafana will not fix the problem for you, but it helps you understand where the problem might be.
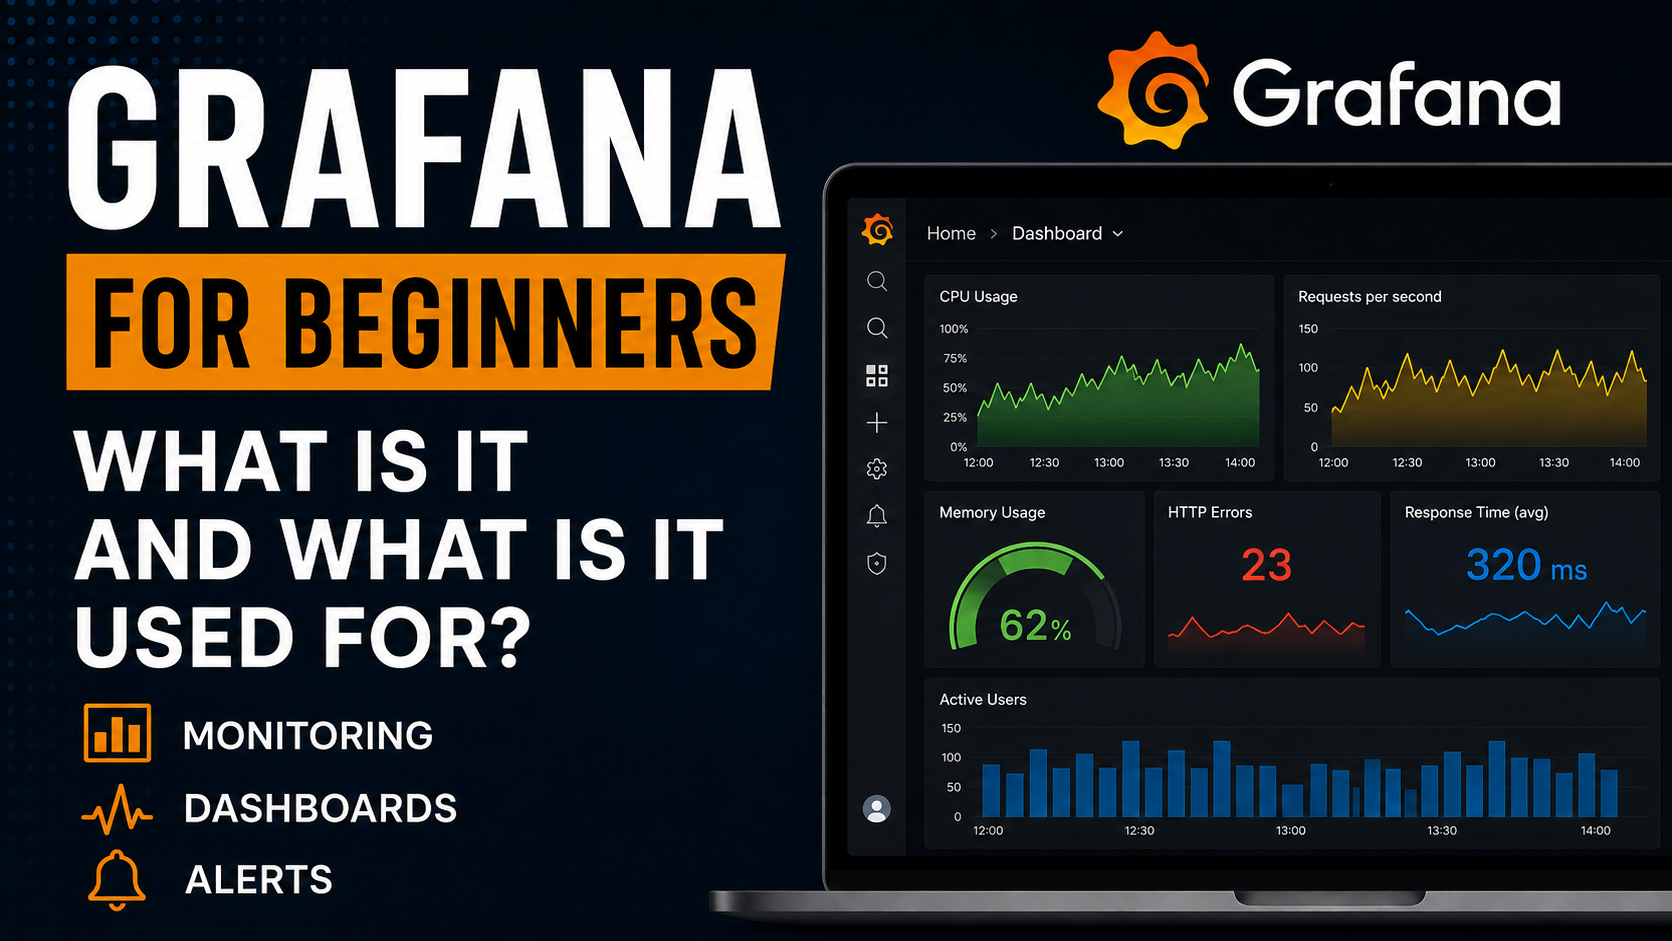
Dashboards in Grafana
One of the most important concepts in Grafana is a dashboard.
A dashboard is a screen that contains different panels with data.
On such a dashboard, you can have for example:
- a CPU usage chart,
- a RAM usage chart,
- the number of active users,
- the number of HTTP 500 errors,
- average API response time,
- service status,
- number of requests per minute,
- database load.
Thanks to this, you can see the most important information about your system in one place.
It is a bit like a car dashboard.
You do not need to know every technical detail of the engine, but you can see the speed, fuel level, temperature, and warning lights. Grafana works in a similar way, but for applications, servers, and infrastructure.
Where Does Grafana Get Data From?
This is very important: Grafana does not collect all data by itself.
Grafana usually connects to other tools that collect or store data.
Popular data sources for Grafana include:
- Prometheus,
- InfluxDB,
- Loki,
- Elasticsearch,
- MySQL,
- PostgreSQL,
- Zabbix,
- CloudWatch,
- Azure Monitor,
- Google Cloud Monitoring.
So Grafana is a place where you can connect different data sources and present them in one readable interface.
This is very useful because in real projects, data is often spread across multiple systems.
Some metrics may be stored in Prometheus, logs in Loki, business data in a database, and infrastructure data in the cloud. Grafana allows you to connect all of this and display it in one place.
Grafana and Prometheus — What Is the Difference?
Grafana is very often used together with Prometheus.
And this is where many beginners get confused because they do not know the difference between the two.
The simplest explanation is:
Prometheus collects and stores metrics.
Grafana displays those metrics as charts and dashboards.
So Prometheus is more responsible for the data, while Grafana is responsible for presenting that data.
For example:
Prometheus can collect information about how much RAM a server is using. Grafana can display this information as a readable chart.
That is why the combination of Grafana + Prometheus is very popular in DevOps and monitoring.
What Can You Monitor in Grafana?
You can monitor many different things in Grafana.
The most common examples are:
1. Servers
You can monitor CPU usage, RAM usage, disk usage, network traffic, system load, and many other parameters.
This is useful for system administrators, DevOps engineers, and anyone responsible for infrastructure maintenance.
2. Applications
You can check how your application is working:
- how many errors it has,
- how fast it responds,
- how many requests it handles,
- whether something became worse after deployment,
- whether users are experiencing problems.
This is especially important for production applications.
3. Databases
Grafana can help you monitor databases, for example:
- number of queries,
- response time,
- load,
- number of connections,
- errors,
- slow queries.
This makes it easier to notice when the database becomes a bottleneck.
4. Containers and Kubernetes
If you work with Docker or Kubernetes, Grafana can also be very useful.
You can monitor:
- containers,
- pods,
- nodes,
- resource usage,
- restarts,
- service availability,
- cluster errors.
In microservice environments, this type of monitoring is almost necessary.
5. Logs
Grafana can also be used to analyze logs, for example together with Loki.
This means you can not only look at metrics but also check specific events and errors stored in application logs.
6. Alerts
Grafana also allows you to create alerts.
For example:
If CPU usage exceeds 90%, Grafana can send a notification.
If the application starts returning many HTTP 500 errors, Grafana can notify the team.
If API response time becomes too high, you can receive an alert in Slack, by email, or in another tool.
This is very important because monitoring without alerts often means that someone has to manually watch the dashboard. And in practice, nobody will sit all day refreshing charts.
Why Is Grafana So Popular?
In my opinion, Grafana is popular for several reasons.
First, it is very readable. You can create dashboards in a way that even less technical people can understand what is happening.
Second, it integrates with many data sources. It is not a tool limited to one specific system.
Third, it is very flexible. You can create a simple dashboard for one server, but you can also build a more advanced observability solution for large systems.
Fourth, Grafana is widely used in companies. This means that knowing this tool can be a big advantage, especially if you are interested in DevOps, system administration, performance testing, monitoring, or application maintenance.
Grafana in Software Testing
Grafana is usually associated with DevOps engineers and system administrators, but in my opinion, testers should also know it.
Why?
Because the tester’s work more and more often does not end with clicking through an application before deployment.
In many teams, QA is also involved in analyzing system quality after deployment. In that case, it is useful to know how to check:
- whether the application is stable,
- whether the number of errors increased after release,
- whether the API responds more slowly,
- whether performance tests reveal real problems,
- whether the infrastructure is overloaded,
- whether users have problems after deployment.
Grafana can be a great tool for technical testers, automation testers, or anyone who wants to move more toward QA Engineering, DevOps, or SRE.
For example:
You run a performance test in JMeter or k6. The test results alone are useful, but when you combine them with monitoring in Grafana, you can see much more:
- how the server behaved,
- when CPU usage increased,
- when response times started to grow,
- whether the database was overloaded,
- whether the application had memory problems.
This gives you a much better picture than a test report alone.
Grafana and Observability
In the context of Grafana, you will often hear the term observability.
In practice, observability means more than simple monitoring.
Monitoring often tells us: “something is wrong.”
Observability helps us answer the question: “why is something wrong?”
In observability, we often talk about several types of data:
- metrics,
- logs,
- traces,
- profiles.
Metrics show numbers, for example CPU usage, RAM usage, response time, or number of errors.
Logs show specific events, messages, and errors.
Traces help track the flow of a request through different parts of a system, which is especially important in microservice architectures.
Grafana fits very well into this world because it allows you to analyze and present these types of data in one place.
Is Grafana Difficult?
At the beginning, Grafana may look complicated, especially if you see dashboards, data sources, queries, and alerts for the first time.
But the basic idea is simple.
You have data.
You connect a data source.
You create a dashboard.
You add panels.
You configure charts.
Optionally, you configure alerts.
The biggest difficulty is not clicking around in Grafana, but understanding what you actually want to monitor.
Because you can have a beautiful dashboard that tells you almost nothing.
And you can have a simple dashboard that immediately shows the most important problems.
That is why Grafana is not only about creating charts. It is about asking good questions:
- what is important for the system?
- which metrics show a real problem?
- when should we receive an alert?
- which data helps with troubleshooting?
- what do we want to see after deploying a new version of the application?
This is much more important than the visual design of the dashboard.
A Simple Example of Using Grafana
Let’s say you have a simple web application and a Linux server.
You want to know:
- whether the server is running,
- how much CPU it uses,
- how much RAM it uses,
- whether the disk is running out of space,
- how many requests the application handles,
- whether errors appear,
- what the response time is.
In this case, you can build a Grafana dashboard that shows all of this information in one place.
When you open the dashboard, you can immediately see whether the system is working normally or whether something suspicious is happening.
This is exactly the moment when Grafana starts to make sense.
Not as “nice charts”, but as a real tool for controlling the quality of a running system.
Who Should Learn Grafana?
Grafana is especially useful for people who work or want to work in areas such as:
- DevOps,
- QA Engineering,
- performance testing,
- system administration,
- application monitoring,
- SRE,
- cloud computing,
- Kubernetes,
- backend development,
- production application maintenance.
In my opinion, Grafana is also a very good tool for people who want to go deeper into the technical side of IT.
If you know only the basics of testing or programming, Grafana can help you better understand how applications behave after deployment.
And that is very valuable knowledge.
Is Grafana Worth Learning?
Yes, definitely.
Grafana is practical, popular, and used in real projects.
It is not a technology you learn only to “add something to your CV”. It is a tool that can actually help in everyday work.
With Grafana, you can:
- detect problems faster,
- better analyze application behavior,
- monitor infrastructure,
- create dashboards for your team,
- configure alerts,
- connect data from different sources,
- better understand how systems behave in production.
And that is exactly why Grafana is so commonly used in companies.
Summary
Grafana is a tool for visualizing, monitoring, and analyzing technical data.
It allows you to create dashboards, connect different data sources, analyze metrics, logs, and traces, and configure alerts.
It is most often used to monitor applications, servers, databases, containers, Kubernetes, cloud services, and IT infrastructure.
If you are interested in DevOps, QA, performance testing, system administration, or you simply want to better understand what happens with an application after deployment, Grafana is definitely a tool worth learning.
At the beginning, it may seem a bit technical, but once you understand the basics, you will quickly see that its biggest strength is simple: it shows clearly what would normally be hidden in metrics, logs, and monitoring systems.
And in IT, that is really valuable.